Following a year of rapid interest rates increases, investors entered the period under review focussed on how much more monetary policy tightening was necessary to tame inflation. Expectations of how high and for how long interest rates would need to stay at those elevated levels have shifted considerably over the course of the year, driven in turn by monthly sets of inflation and economic data, commentary from central bankers themselves as well as fears that tighter financial conditions risked causing a systemic shock to the banking system. Whilst headline inflation had peaked in the US in June 2022 at 9.1% and at over 10% in October 2022 in the UK and Eurozone, throughout 2023 it was showing clear signs of falling lower, although the path back down to the target rate of 2% inflation was unlikely to be the same for each economy. The US Federal Reserve (FED), the US central bank, had been the most aggressive central bank to increase interest rates this cycle and entered the period with interest rates already at 4.75%. With core inflation, which strips out the more volatile housing and energy components, also already falling, investor hopes were growing that peak rates were relatively close at hand. However, despite the rapid succession of interest rate rises announced by the FED, the economy was proving stronger than expected. Whilst there is always a lag between an interest rate rise and the point at which the impact of that monetary tightening is felt in the economy itself, the first six-months of the period provided central bankers with limited firm evidence that either domestically generated inflation in the economy was falling at a sufficient pace or that the engines of economic growth were cooling down fast enough. Core inflation, whilst falling, was proving stickier than expected and caused the central bank to increase interest rates a further 0.75%. Buoyant consumer spending, helped by drawing down excess savings built up over Covid, and a stronger than expected jobs markets has seen GDP forecasts for the US increase from below 1% for 2023 and 2024 to above 2% in each year. Such strong economic growth did not provide the necessary evidence that domestic drivers of inflation were abating. In the Eurozone and UK, core inflation continued to rise, peaking only in May, causing central bankers in both regions to raise rates by a further 1.25% and 1.5% respectively. Gross Domestic Product (GDP) growth turned out to be much stronger in 2023 than previously forecast, at 0.4%, this was still weak and more a reflection of the fact economists had been widely expecting the UK to fall into a steep recession last year. In the Eurozone, GDP growth was similarly weak although more in line with expectations.
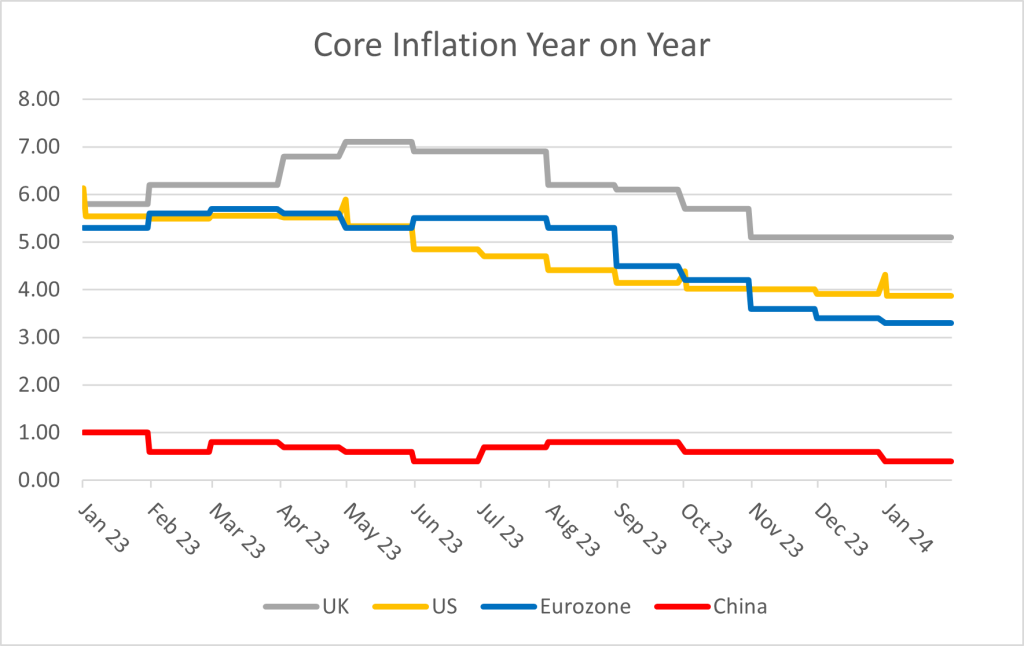
This chart shows the change in core inflation year on year.
Whilst the first half of the year saw stronger economic growth, by the summer there were signs emerging that further rate tightening might risk tipping economies into recession and that a pause was warranted in order to let the lagged impact of previous policy action work its way through the system. By August, US business activity surveys indicated that there had been a sharp recent decline in activity and that the global economy was teetering on the edge of stagnation. Whereas previous weakness had been concentrated in manufacturing, it became clear that weakness had started to spread to the services sector of the economy too. As a result, the July rate rise announced by the FED proved to be its last and the market focus since that point has shifted away from what level rates would peak at to how long they would remain there for, at which point and by how much they could be subsequently cut.
The fragility of the financial system to such a rapid change in financial conditions had been demonstrated in March by the collapse of four US regional banks as well as Credit Suisse in Europe. As a result, the FED preferred to hold its interest rate at 5.5% rather than causing a policy error and tipping the economy into a deep recession. These collapses brought back memories of the Global Financial Crisis of 2008 and markets were quick to question the extent to which the issues that caused these banks to fail were due to specific mismanagement or were more systemic in nature and could lead to financial contagion. Since the Global Financial Crisis in 2008, there has been a significant overhaul of the global banking regulation with significant improvements in the amount of capital banks hold as well as their leverage and their liquidity. The conclusion that investors drew over the remainder of the year was that the issues faced by these banks were largely driven by specific mismanagement of their balance-sheets as funding sources were poorly diversified, lending was too concentrated on certain sectors of the economy and losses from supposedly ‘low-risk’ government bonds had had to be crystallised in order to pay back depositors who withdrew their cash.
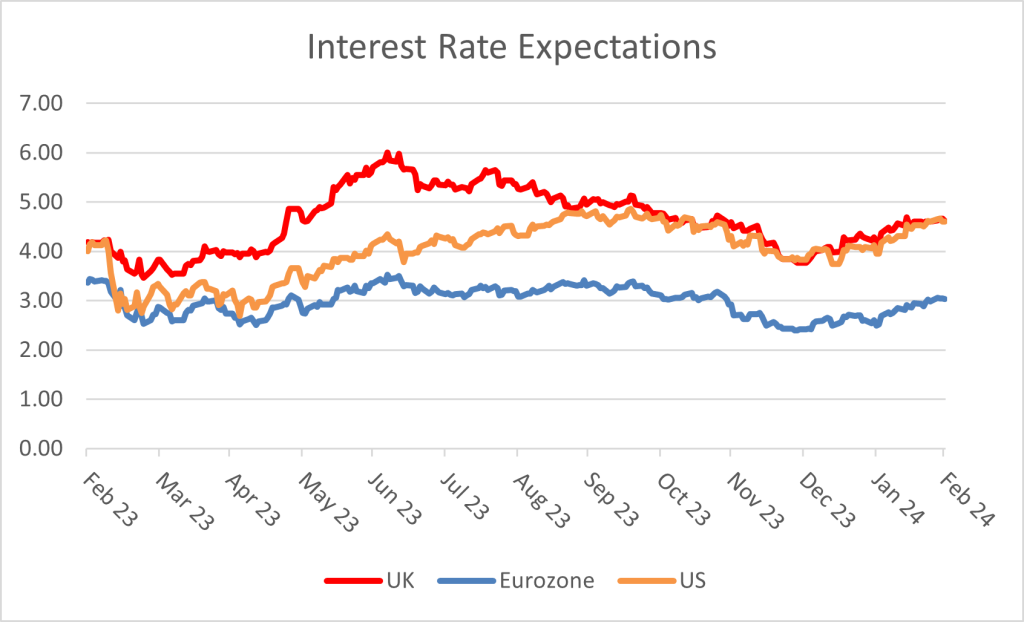
Despite weaker economic growth in both regions, the UK and Eurozone saw more interest rate rises than the US, as discussed. With the Bank of England (BOE) and European Central Bank both playing catch up against the FED it was not until August and September that the peak of the current rate cycle appears to have been reached, at 5.25% and 4.0% respectively. Whereas for both the US and Eurozone investor expectations of where interest rates were likely to peak were little changed since February, in the UK there was a significant reassessment of how much further tightening was necessary to curb inflation. At the start of the period investors had hoped interest rates would only have to rise a further 0.75% from 4%, but stronger inflation data in May and June led to a significant reassessment from the BOE of the economic outlook and as a result the level at which rates peaked was 0.5% higher than initially expected.
The period through to the end of October provided investors with limited reason for optimism that interest rate cuts might be on the horizon, particularly given recent data that showed the US economy had grown at an annualised rate of 4.9% in the third quarter and created more than 300,000 jobs over the previous month. The Palestinian-Israeli conflict in the Middle East added to investor risk aversion as concerns grew that the current situation could spread within the wider region. In November, however, the first real hopes emerged that investors could shift their attention to the timing of the first interest rate cut. Having remained stubbornly strong for some time, there was welcome confirmation for investors of the anticipated slowdown in the labour market. Eurozone inflation fell more than expected to 2.9 per cent in October, the slowest annual growth in consumer prices since July 2021. Similarly, US inflation and UK fell more than expected. Whilst investors were quick to shift from their previous glass half-empty position to a much more positive one, central bankers acted as a counterweight repeating their position that the war against inflation was not yet won and the last phase of getting inflation down to their 2% targets could prove to be the most difficult. It was surprising, therefore, that the following month Jerome Powell, Chairman of the Federal Reserve, abandoned his normal stance of tempering investor optimism, indicating instead that the present interest rate cycle was not only over but that the central bank was also very focussed on not waiting too long to cut rates. By their own projections, US policy rate was anticipated to fall by 0.75% in 2024 and a further 1% in 2025, before stabilising at 2.75% in 2026. The resultant impact this had on the market view on global interest rates was perhaps best explained by looking where investors expected interest rates to end 2024 compared to their expectation a month earlier. In the US and the Eurozone investors had priced in a further 0.50% of interest rate cuts over the following year whilst interest rates in the UK were expected to be 0.75%. The volatility of these expectations has been particularly marked in the UK. Over the course of the summer, investors expected interest rates to end 2024 at 6% whereas less than six months later that expectation had fallen back to 3.75%.
In some ways 2024 started in a similar vein to the year earlier. Investor optimism had grown over the previous couple of months only to be disappointed by subsequent economic data. At the start of the 2024, investors believed both that the major global economies would successfully ride out the latest hikes in interest rates without tipping into a painful recession and that the year ahead offered the prospect of meaningful interest rate cuts. However, data released in January and February showed that the US jobs market has continued to remain more buoyant than expected, GDP itself grew at a stronger than expected rate in the final quarter of the year whilst inflation data in the Eurozone, US and UK saw a slight but unhelpful re-acceleration in December and core inflation in the following month was stronger than hoped. As a result, the period under review ended with Jerome Powell explicitly stating that a March rate cut was not the Fed’s base case whilst also tempering expectations for the quantum of rate cuts to come. Closer to home, the BOE similarly stated that more evidence was necessary that inflation will fall all the way to its 2% target before rates could be cut.
Whereas the broad outlook for global economic growth has been more positive than expected, China has been a notable pocket of weakness during the period, failing to rebound as strongly as hoped following the relaxation of Covid restrictions. Whilst western economies have been battling with elevated levels of inflation, China has fallen into deflation. In January, China’s consumer prices fell at the fastest rate in 15 years, the fourth straight month of declines. The fall came as China’s economy contends with an extended property market decline as well as weak manufacturing and export demand.
Against this backdrop of shifting interest rate expectations and divergent regional economic growth, the period witnessed a similarly wide range of performance outcomes across asset classes and regions. US equities rebounded strongly from their prior year of weak performance with the market up over 25% in sterling terms. Performance was led by a small handful of large US technology names, the so-called “Magnificent Seven” (Alphabet (Google), Amazon, Apple, Meta (Facebook), Nvidia, Tesla and Microsoft), with the index of technology companies rising over 35% in sterling terms. The concentration in market indices has become more extreme with these 7 stocks alone now accounting for close to 30% of the US market and 20% of the World Index. Enthusiasm for the AI-theme was a notable driver of performance, however, outside the top 1000 names in the index smaller companies (with limited direct exposure to this theme) rose only 5%. The dispersion in performance between global growth companies and value companies was marked and a wide gulf has re-opened in valuations between these two segments of global equity markets. Having been an outlier the previous year delivering positive market performance, the UK struggled to make progress over the last 12 months. There was further divergence in performance between the UK large companies index and the next 250 mid-sized companies, which fell over the course of the year. Over 3-years the divergence in performance has now reached over 30% between these two parts of the UK market, with the smaller, more cyclical companies failing to make any headway over the period. Elsewhere, European and Japanese equity markets were strong performers rebounding from low valuations and driven by signs corporate governance reforms were starting to bite. Conversely, Chinese equity markets were poor, falling 18% in sterling terms, as investor optimism for a strong Covid-related recovery was undermined by the subsequent weak economic data.
Bond markets were relatively subdued over the period. As interest rates moved higher and the timing of interest rate cuts was pushed further out, government bonds suffered from capital values falling. However, with coupons (the annual payment to investors) now at more reasonable levels, these were generally sufficient to more than offset this headwind. Corporate bonds performed better, benefitting from higher coupons than government bonds and as credit spreads (the excess coupon demanded by investors over and above government bonds) narrowed as economic growth came in stronger than expected thus reducing the prospect of default (non-repayment) as a consequence.
Commodity markets were a mixed bag. Oil and Gold were relatively strong, however, industrial mining companies were weak driven by weaker Chinese demand, higher operating costs and increased supply in certain commodities.
Performance
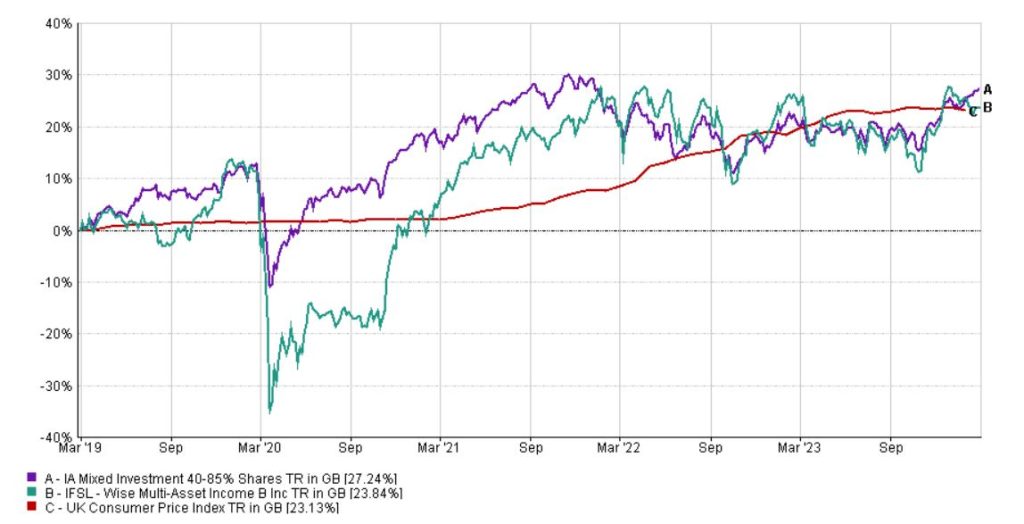
Given the market backdrop described above, our focus on income generation, the value bias to our process and the specific underperformance of the investment trust sector in the period, the Fund struggled to make progress following the strong rebound in performance over the previous 24 months. Over the 12-month period, WS Wise Multi-Asset Income fell 0.6% (B Income shares). Over this period, we underperformed the Consumer Price Index, which measures inflation and as explained above remains above the Bank of England target, up 2.8%. We also underperformed the comparator benchmark, the IA Mixed 40:85% Investment sector, which rebounded strongly, up 6.2%.
Source – Wise Funds 29th February 2024
For more fund performance, please see the latest factsheet
Wise Multi-Asset Income February 2024 factsheet
Source: Wise Funds February 2024. Please note, data includes 2 monthly estimates for February and March 2024 payments.
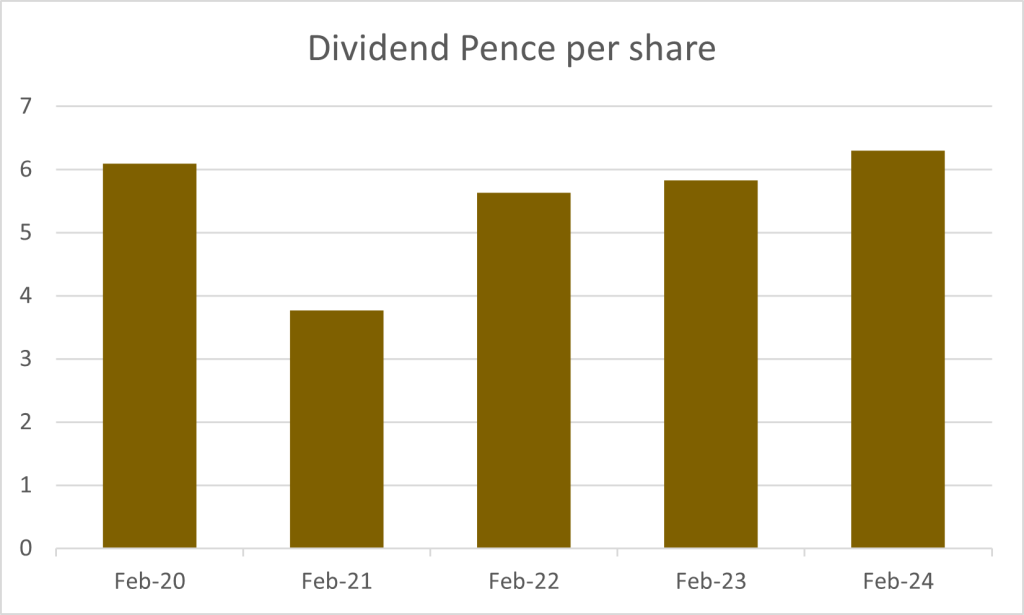
Over 5 years as per our objective, the Fund has risen 23.8% compared to its target benchmark, the Consumer Price Index, which rose 23.1%, and the comparator benchmark, the IA Mixed 40:85% Investment sector, which rose 27.2%. Our strong focus this year has been to continue to grow the distribution per unit over the last twelve months and are pleased to report growth from 5.82p to 6.28 pence per share, an increase of 8% over this period. As anticipated last year, this is well ahead of inflation and reflects continued underlying growth in payments from our holdings as well as rotation out of lower-yielding assets as they perform well into higher yielding out-of-favour opportunities. As a result, the historic yield on the fund has increased from 4.6% to 5.4% over the period.
Investment Trust Sector
Before discussing the performance of individual holdings in the fund it is worth highlighting that a large element of the Fund’s underperformance this year came from discount widening of the investment trusts themselves rather than the underlying net asset value performance of their holdings. Recent months have seen a perfect storm for the investment trusts sector, caused by continued outflows from UK equities, dislike of smaller companies, a reduction of the traditional pool of investors due to consolidation amongst wealth managers and, most frustratingly, unhelpful regulatory changes forcing long-established investors to sell.
Over time we believe that the performance of investment trusts can be amplified as excitement or fear over the underlying asset classes is translated into tighter or narrower discounts. In recent years, negative investor sentiment towards UK Equities has been particularly acute and we have highlighted the underperformance of small & mid-sized UK companies in recent years. All of our investment trusts (75% of the portfolio at the end of the period) are listed in the UK and many form part of those indices and so have suffered from indiscriminate basket selling of those names.
Furthermore, regulatory changes on costs disclosure also had a widespread negative impact on the investment trusts sector. New rules, which are actively being challenged in Parliament as we write, force funds of investment trusts to double-count the costs of the trusts they invest in, thus artificially inflating the Ongoing Charges Figures (OCF) disclosed to clients. This change of rule from the regulator has forced many investors out of investment trusts because their clients risked being put off by what appear to be higher fees now being disclosed, even though the change is purely presentational and has no impact on performance. The most frustrating aspect of this regulation is that the British regulator blames European regulation for this change, and yet it is the only European country to have interpreted the regulation so absurdly. As a result, the UK has created widespread damage to a once vibrant sector which represents roughly a fifth of all the listed companies in the UK and is perfectly suited to provide capital to the exact areas the government is keen to promote, like infrastructure and renewables, or domestic private equity. No other fund structure offers such easy, liquid and affordable access to those sectors for retail investors. We can thus only hope that reason will prevail and that this double-counting of costs will come to an end soon.
Looking at the entire universe of investment trusts in the UK, discounts widened by ~4.5% between the end of February and the end of October 2023, at which point the average discount reached the widest since the GFC. This headline figure hides some greater moves, such as Property investment trusts discounts which widened by ~11% and Infrastructure ones which widened by close to 15%. The more interest rates sensitive the strategy, the more impacted they were, which was a particular headwind for the fund given its income focus. Looking purely at those holdings held at the start and the end of the period, our average discount widened from 6% to 11% and accounted for an estimated 3.0% performance headwind for the fund alone. Over time, we would expect these abnormally wide discounts to revert closer to long-term averages and provide investors in the fund for an extra source of performance.
Detailed contributions to performance
Our strongest contributors to performance over the year came from fixed income, specialist financial equities (direct and via funds), property and private equity. In many regards, this is somewhat surprising and highlights the idiosyncratic investment opportunities that exist within asset classes even when one appears to be swimming against the tide. Given the comments above about the relatively subdued performance of bonds over the period, it was encouraging to see the Fund’s bond exposure reassert its more defensive attributes over the period. In particular, TwentyFour Income Fund, a bond strategy that invests in floating rate asset backed securities, such as mortgages, delivered very strong performance mitigating the negative impact of higher rates one would normally expect on the asset class given the coupons it receives move higher at the same time. Starwood Real Estate Finance announced a series of distributions of capital over the period with the board having responded to the persistent discount to the net asset value by deciding to cease new lending and return the proceeds to shareholders. The TwentyFour Strategic Income Fund, a diversified bond strategy, added to the portfolio in the prior period also performed strongly.
Our financials holdings rallied from weak performance in the first half of the period. Fears of contagion from the US regional bank failures coupled with concerns that the benefit of higher rates might be offset by higher impairments as borrowers struggled to cope had seen valuations drop. However, it was noticeable that the news flow from the companies themselves did not reflect the weakness in their share prices and the prospect of looser monetary policy in the latter months of 2023 ignited a sector where valuations had become overly pessimistic. Paragon Banking Group, a buy-to-let lender, was notably strong following an excellent set of full year results delivering record profits, strong dividend growth and the prospect of further share buy backs. Polar Capital Global Financials also performed particularly strongly in the second half of the year. Numis, a broker to mid and smaller sized UK companies, which has been operating in cyclically weak investment banking and trading markets for the previous eighteen months, received a bid approach from Deutsche Bank at a 70% premium. Vanquis Banking Group, however, provided a disappointing trading update and was sold.
As interest rates have risen in the UK, sectors that reference government bond yields when considering valuation came under pressure. With persistently strong wage growth data and core inflation remaining high, real bond yields rose over the last twelve months. Real yields are the return investors expect after stripping out the negative impact of expected inflation. This proved a difficult backdrop for both property and infrastructure names which suffer when bond yields rise. Over the longer term, this negative headwind should be offset if the cause of higher yields (namely inflation) is captured either in higher inflation-linked regulatory revenues in the case of infrastructure or via higher property rents. However, when yields rise over and above the change in inflation expectations, this means investors have increased the underlying return they demand from those assets. This explains the broader discount widening in the property and infrastructure sectors but left both sectors offering very attractive yields with an element of inflation protection.
The relative performance of our property and Infrastructure holdings was, therefore, noticeable over the period. Despite the broader backdrop of property market weakness, for the Fund property represented one of the best performing asset classes, although performance was very dispersed and included some of our best and worst performing holdings over the period. Abrdn Property Income, Urban Logistics, Impact Healthcare REIT and Helical underperformed despite enjoying strong rental growth in the end markets to which they are most exposed, such as industrial property and care homes. Once very significant discounts to net asset value (NAV) are factored in, the implied yields on the underlying assets now look highly attractive whilst there appears to be limited stress from overly stretched indebted balance-sheets. Whilst discounts to NAV can imply private market valuations are out of date and it is only a matter of time until they catch up with where public markets have already got to, they also can reflect the fact public markets have become overly pessimistic and do not reflect the underlying value of those businesses. Two holdings within the portfolio accepted this to be the case and came under pressure to sell assets in the market in order to prove up their asset values. Both Palace Capital and Ediston Property, two of our larger property holdings, undertook such strategic reviews and progress in soliciting bids for assets close to NAV saw their shares respond strongly over the period and more than make up for the general weakness elsewhere. A timely addition to our holding in TR Property also helped performance. As long as deep discounts to NAV and high implied yields on the underlying property assets persist within the sector, we expect to see boards put under increasing pressure either to realise assets, reduce leverage, buy back shares or consolidate. It was unsurprising, therefore, to see Abrdn Property Income subject to a merger proposal from both Custodian REIT as well as Urban Logistics towards the end of the period. We have encouraged the board to consider both proposals against the alternative of a managed disposal of the assets.
Similarly wide discounts existed in the Private Equity sector and another strong performer during the period was CT Private Equity. Whilst underlying asset performance has been resilient, performance has mainly been driven by discount narrowing. Investor focus has shifted from concerns over valuation and leverage to recognising the quality of the underlying companies and accepting discounts were overly pessimistic. This view was helped by the decision of a large competitor fund committing to a significant ongoing repurchase of shares rather than reinvestment into new holdings given the compelling investment logic of such a shift in asset allocation. ICG Enterprise was added to the portfolio in the period and delivered similarly strong returns.
We see many similarities between the Property and Infrastructure sectors at the moment. There appears to be a disconnect between the prices being paid for assets on the ground and the discounts at which the investment trusts themselves trade at. Whereas our Property holdings benefitted from a greater level of corporate activity that boosted performance, discounts on our Infrastructure holdings widened significantly although the boards of the investment trusts are not standing idly by whilst value remains unrecognised by the market. Within the core infrastructure sector, HICL Infrastructure announced the disposal of one of its largest holdings, a US toll-road, at a 30% premium to its latest carrying value. This compares to the shares which traded at 24% discount. Having realised proceeds of over £500m at a premium to net asset value over the last 12 months to prove up the portfolio value, the company has now paid back in full its debt facility and will embark on a £50m buy back of shares. Similarly, International Public Partnerships announced the disposal of four investments at a modest premium to the latest NAV, highlighting the extent to which the current discount undervalues the company whilst enabling the group to pay down their expensive debt facility and undertake a buy back of shares. Despite these efforts, however, discounts of over 20% are common even for a trust such as Ecofin Global Utilities and Infrastructure, which invests in liquid, listed global equities.
Our equity exposed funds provided mixed returns. Our UK equity funds were relatively flat whilst regional and specialist funds International Biotech, Blackrock Frontiers and CC Japan Income & Growth performed well. Our commodity exposed funds, Blackrock World Mining and Blackrock Energy & Resources suffered both from weak underlying commodity markets and steep discount widening in the period.
Allocation Changes
Given the attractive yields available in more defensive asset classes and the expectation either that we are getting closer to the point at which interest rates are peaking or that those defensive characteristics will become more attractive should growth weaken from here, we initiated two new holdings in the core infrastructure sector, HICL and International Public Partnerships. Similarly, we have added to our holding in Ecofin Global Utilities and Infrastructure, a fund which invests in equities of utility and infrastructure companies. This represented the biggest change in allocation in the period as the sector exposure increased from 3% to 15%.
In a similar vein, we added exposure to fixed income as yields of government and corporate bonds and asset backed securities (eg mortgages) look increasingly attractive given the movement in base rates globally. We topped up our holding in the Twenty Four Strategic Income Fund, an unconstrained fund that seeks value from across the global bond markets.
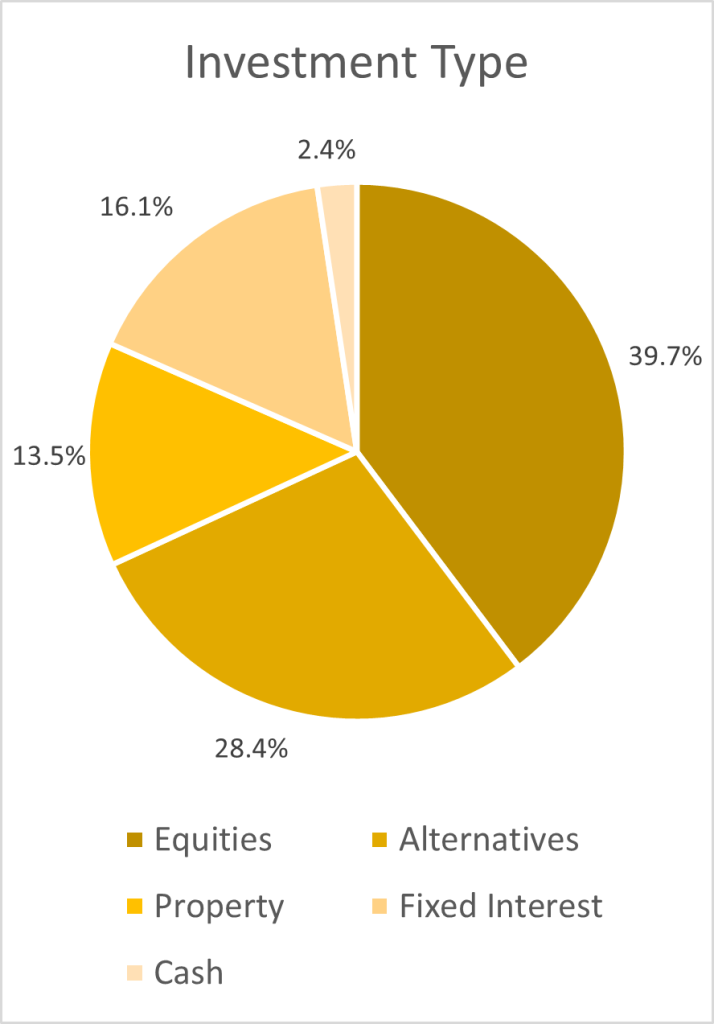
Within our property holdings, we exited our holding in Palace Capital, taking advantage of strong share price performance in response to the updated strategy and a company share buyback, as we were disappointed by the management remuneration scheme accompanying the proposal to realise the asset value of the company. We also sold our holding in Ediston Property following its proposed takeover. Given attractive discounts to asset value elsewhere, better liquidity and more favourable subsector exposure, we switched our holding into TR Property and Urban Logistics as well as initiating a new holding in Helical, a London office specialist. As a result, our overall allocation to property reduced from 16.6% to 13.5%.
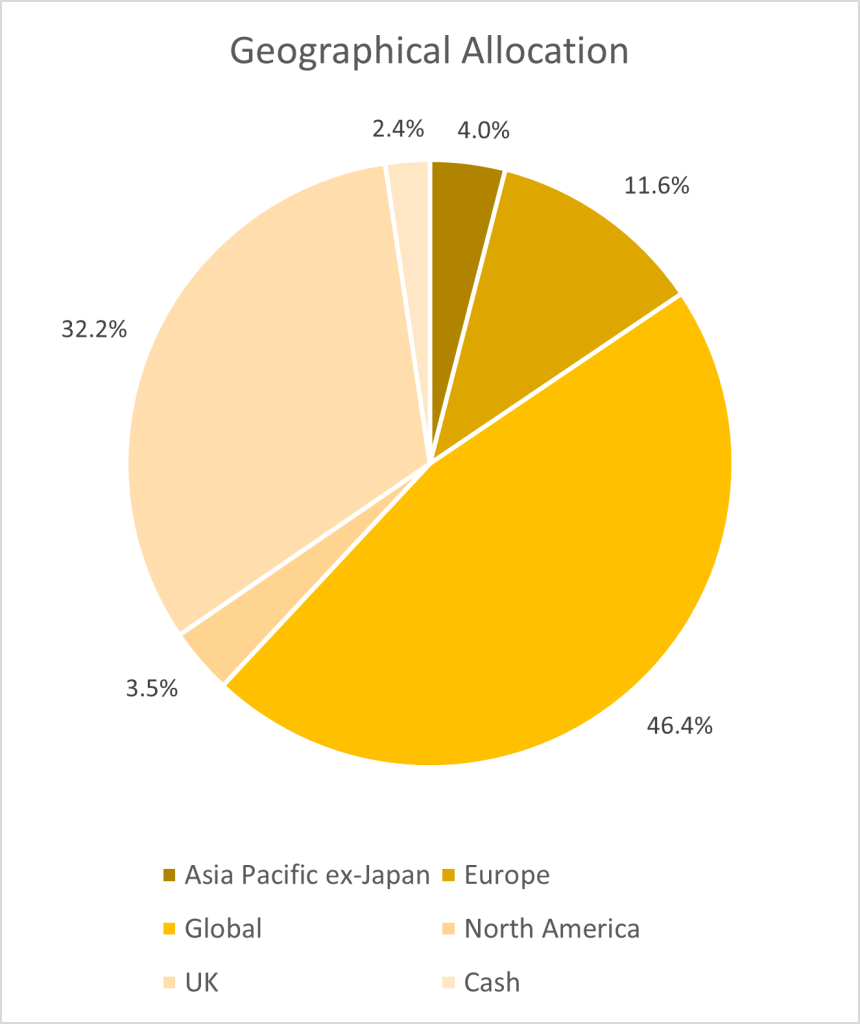
Breakdown of portfolio by asset types as of 29th February 2024
We have reduced risk within the portfolio by further selling down our direct equity holdings. Chesnara, Henry Boot, Numis and Vanquis Banking Group were all sold and Paragon was reduced following strong performance. Direct equities now represent 6% of the portfolio down from 12.5% at the start of the period. Proceeds were partially reinvested into equity funds with attractive underlying valuations that traded at wide discounts, such as Fidelity Special Values, International Biotechnology and Polar Capital Global Financials. We also initiated a new holding within the private equity sector, ICG Enterprise Trust, a defensively run portfolio that traded on a historically wide discount. This position was partially funded from CT Private Equity which has seen very strong relative performance.
Within our equity fund allocation, we sold out of Temple Bar and reinvested the proceeds into open-ended funds, Man GLG Income, Schroder Global Equity Income and Jupiter Income (subsequently sold due to the departure of the manager), which are all managed with a similar value approach. We exited both CC Japan Income & Growth and Blackrock Frontiers following a strong period of performance.
Outlook
Investor sentiment will continue to fluctuate depending on whether monthly data supports or undermines the prospect of interest rates cut over the course of the year. In the first couple of months of 2024 investor optimism around the timing and quantum of cuts has tempered somewhat, leading to a more balanced outlook in this regard. It remains to be seen, however, whether growth will continue to surprise positively or whether the embedded tighter financial conditions start to bite. Whilst headline inflation has fallen significantly closer to target levels, core inflation remains at levels that central bankers will continue to find uncomfortably high and, having been on the back foot in recent years, we should not expect them to pre-empt victory on the war on inflation and to loosen monetary policy too quickly. There will undoubtedly be regional variations in asset returns ahead, however, it is unlikely that we will see such dominance from US equity markets once again given how historically stretched valuations in the technology sector have become. The lacklustre growth in China remains a concern and geopolitical risks (such as Ukraine and Gaza) leave room for possible surprises. 2024 also represents a ‘Super Election Year’ with nearly half the world’s voters expected to be heading to the polls. Whilst this provides an extra possible source of surprise, markets are less likely to be caught off-guard by the re-election of Trump than they were in 2016 and the prospect of a change in leadership in the UK has been considered now for many months.
It is encouraging though against this backdrop to be able to build a portfolio where the core equity allocation is supported by valuations that remain historically cheap. Our income focus and value bias mean our geographic exposure is very different to that in global equity indices. We are well positioned if the extreme valuation dispersion we see in the equity markets narrows back to more normal levels and have not been surprised to see a noticeable pick up in merger and acquisitions, particularly in UK mid-sized companies, reflecting cheap valuations and confidence that costs of financing those deals is unlikely to rise steeply from here. At the same time, we also see increasingly attractive opportunities within traditionally lower-risk asset classes, such as bonds and infrastructure, as described above. Coupled with the specific discount opportunity we observe in the investment trust sector, we have been able to construct a portfolio that offers a high historic yield of 5.4%. This is an attractive level and a significant increase on the 4.6% reported last year, notwithstanding the fact our allocation to more defensive areas has increased considerably at the expense of more risky assets, notably direct financial equities. We believe current market conditions offer the best opportunity to build out a more balanced asset allocation than we have seen since before the Global Financial Crisis. The portfolio’s yield looks attractive relative to longer-dated UK government bonds whilst at the same time retains significant scope for the dividend to grow which should over time be reflecting in long-term capital growth.
Finally, on a technical note, you may have noticed that the name of our Fund changed throughout the year. UK funds need to have the designation of their Authorised Corporate Director (ACD) in their name. The ACD is ultimately responsible for a fund’s compliance, as well as ensuring the fund is managed in the best interests of their investors. The ACD is also in charge of appointing the fund manager (in this case, us at Wise Funds). We started the year with T.Bailey as our ACD (the “TB” at the start of our Fund’s name). During the period, T.Bailey were acquired by Waystone, hence the change of prefix from “TB” to “WS”. Meanwhile, since the end of the reporting period, after a peer review, we have concluded that our and our clients’ needs would be better served by switching to another ACD, called Investment Fund Services Limited (IFSL). This means that our Fund’s name will, once again, change to IFSL Wise Multi-Asset Growth from the period starting 1st March 2024. While the acquisition of T.Bailey by Waystone was out of our control, the move to IFSL is not a decision we took lightly because we know how disruptive and confusing those changes can be for our clients. As the fund managers of your Fund, we can reassure you that nothing has changed at Wise Funds Ltd, from a personnel or management perspective. We thus apologise if these changes raised any concerns.
I would like to thank, personally and on behalf of the Wise Funds team, all our investors for their ongoing support, particularly in the current challenging times for financial markets. The Fund started the interim period with £87m under management and finished with £65m, mainly due to outflows from a single client.
Please feel free to contact us if you would like a meeting or have any questions.
Philip Matthews
Fund Manager
Wise Funds Limited
March 2024
TO LEARN MORE ABOUT THIS FUND , PLEASE CONTACT
01608 695 180 OR EMAIL JOHN.NEWTON@WISE-FUNDS.CO.UK
WWW.WISE-FUNDS.CO.UK
Full details of the IFSL Wise Funds, including risk warnings, are published in the IFSL Wise Funds Prospectus, the IFSL Wise Supplementary Information Document (SID) and the IFSL Wise Key Investor Information Documents (KIIDs) which are available on request and at wise-funds.co.uk/our funds The IFSL Wise Funds are subject to normal stock market fluctuations and other risks inherent in such investments. The value of your investment and the income derived from it can go down as well as up, and you may not get back the money you invested. Capital appreciation in the early years will be adversely affected by the impact of initial charges and you should therefore regard y our investment as medium to long term. Every effort is taken to ensure the accuracy of the data used in this document but no warranties are given. Wise Funds Limited is authorised and regulated by the Financial Conduct Authority, No768269. Investment Fund Services Limited is authorised and regulated by the Financial Conduct Authority, No. 464193.
This presentation is for Professional Clients only and not for re-distribution.
All data is sourced by Wise Funds and any third party data is detailed on the specific page.