The annual period in review was one of uncertainty, volatility and contrasts. At the macroeconomic level, the lack of clarity with regards to the future path of growth and inflation, led to regular, and often sharp, shifts in interest rates expectations, not helped by the lack of clear messaging from global central banks Without a doubt, during the period, central bankers dropped long-term planning and instead reacted to data from one meeting to the next, admitting that they failed to forecast how sticky inflationary pressures would prove to be. As we navigate a period of transition from a world where inflation has been negligible for at least 30 years, to one where inflation might stay elevated for some time, a tug-of-war between proponents of the transitory inflation argument and believers that inflation is turning into a more structural issue is not entirely unexpected. That said, the market’s myopic focus on short-term data and the monthly cycle of central banks meetings runs counter to our investment process which is taking a medium to long-term perspective.
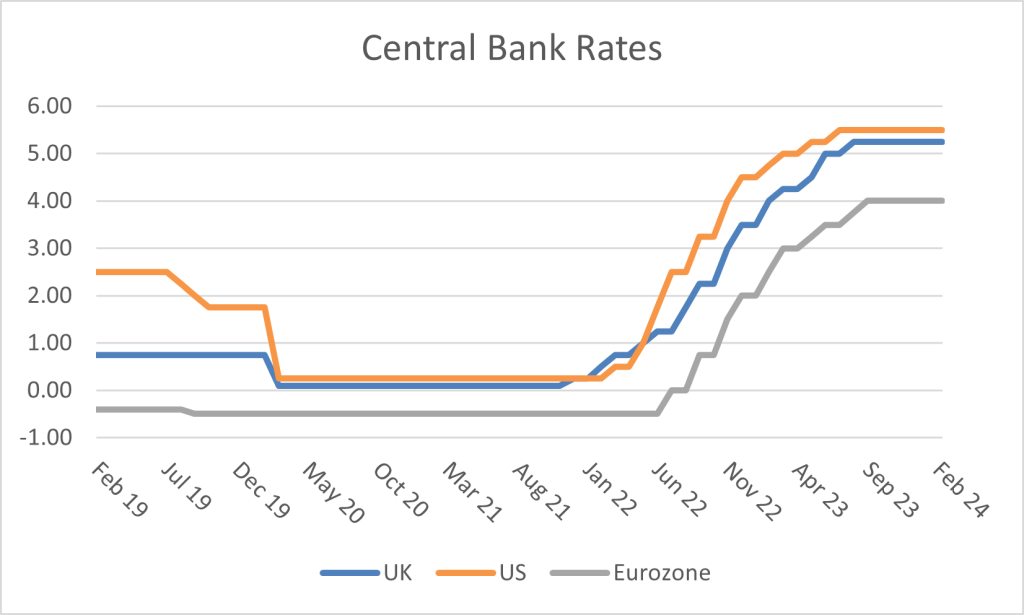
To put things in context, bank rates moved from 4.75% to 5.50% in the US (3 rate hikes), from 4% to 5.25% in the UK (4 rate hikes including one of 0.50% in June), and from 2.50% to 4% in the Eurozone (5 rate hikes including one of 0.50% in March). By the autumn, however, all three regions saw their central banks on hold, giving themselves a chance to observe whether their medicine was strong enough to bring inflation sustainably lower. Generally, inflation proved stickier than anticipated but, by the end of the period, encouraging signs that it had peaked became more and more prevalent. In the US, headline inflation dropped by half from 6% to 3.1% over the year, while the fall was even bigger in the UK (from 10.4% to 4%) and the Eurozone (from 8.5% to 2.8%).
That said, the main concern for central bankers is not so much headline inflation, which is largely driven by external factors, such as energy and food prices, over which interest rates have little impact. Instead, it is the core inflation (inflation stripped of those volatile energy and food prices) which they tend to focus on and it has proved much more resilient to rate hikes so far than desired, particularly due to a tight employment market leading to strong wage growth. A typical interest rates cycle would see central banks engineer an economic slowdown in order to prevent inflation becoming embedded like in the 1970s, but this process is proving harder than usual and the question is now whether they can pull of a “soft landing” (cooling down of the economy without a recession) or whether a “hard landing” has only been delayed and is yet to come. At the end of the period, the message from central bankers was clear that they need further evidence of a sustainable drop in inflation before claiming victory and interest rate cuts would only occur at that point. Given how they missed the surge in inflation post-Covid to start with, this seems like the only sensible course of action they can take.
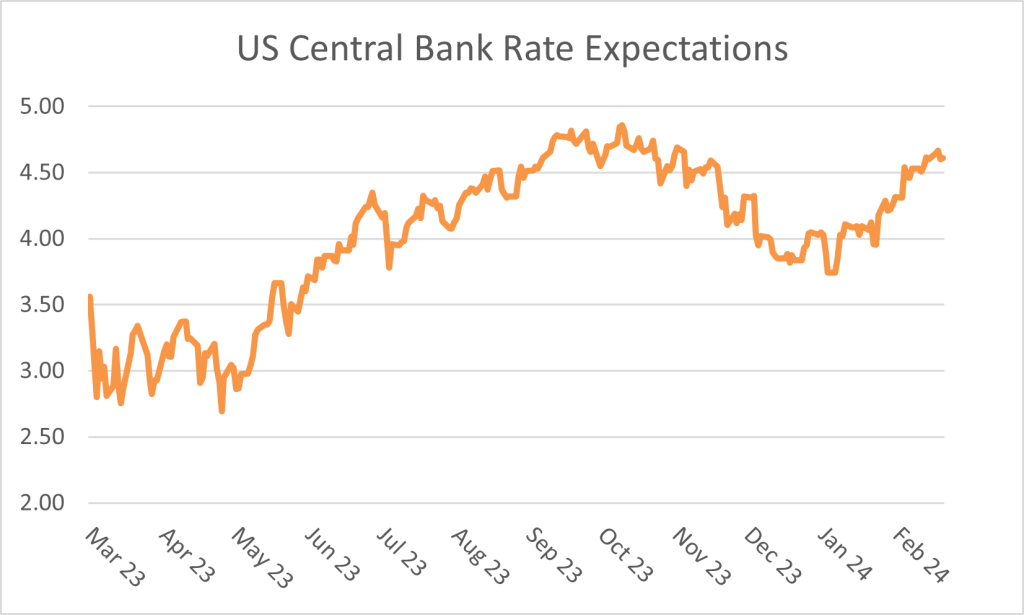
Looking at changes in interest rates expectations during the period is one of the best means to understand the tug-of-war at play and explains the volatility experienced by financial markets. In the US, investors’ expectations of end-of-2024 bank rates oscillated between 2.7% and 4.8%, with each gyration dictated by new data or tweaks in a central banker’s messaging. A similar picture was evident in the UK and Eurozone. Such moves are extremely wild for what are some of the most liquid and followed instruments in financial markets. They are also the most critical ones since all assets are valued using these so-called risk-free rates as a reference point. Each variation in future interest rates expectations thus had ripple effects on other asset classes making for a challenging investment backdrop.
In other developments of significance during the period, more uncertainty was injected in the system in the spring when two (initially and a couple more later) US regional banks collapsed, bringing back memories of the Great Financial Crisis (GFC). Those collapses did not prove systemic, however, and were caused by factors specific to those institutions, namely high concentration of their client types, large average deposit sizes and poor risk management. While idiosyncratic in their nature, those collapses were still an illustration of the impact tightening financial conditions (i.e. higher interest rates) have -and will have- on the economy: interest rates cannot rise by so much so quickly without any breakage. While it is near impossible to predict where the next cracks will appear, one can be confident that there will be more. The number of corporate bankruptcies already increased at double-digit rates in most developed economies in 2023 and this is likely to continue.
Of importance for global growth, China found itself in a difficult position, having been on its own trajectory since the beginning of the Covid pandemic in 2020. After re-opening its economy in Q4 2022, its recovery proved much more tepid than expected, hurt by low consumption, rising youth unemployment, and persisting issues in the property development sector which represents ~25% of its economy. As such, in sharp contrast with the situation in developed markets, the country is battling the worst deflation in 15 years and a stark economic slowdown, with stimulus from the government seemingly the only quick fix available. President Xi appears clear though that stimulating the economy via large infrastructure projects like after the GFC, is not an option and that he favours supporting growth through more traditional routes such as investments in higher technology and increases in military spending.
Finally, geopolitics increased anxiety with a conflict between Israel and Hamas erupting in Gaza, creating yet another human tragedy and stretching international resources and goodwill of allies already involved in the ongoing conflict between Ukraine and Russia. As we entered “the ultimate election year” in 2024 (as described by Time Magazine) with more voters than ever in history heading to the polls (roughly half of the global population), positioning from various candidates and scenario analysis of what change could come out of elections also started to have an impact on financial markets. That impact is especially important at a time when political polarization is extreme and fiscal deficits are hitting record levels in many countries. We thus expect this theme to be increasingly important over the coming months.
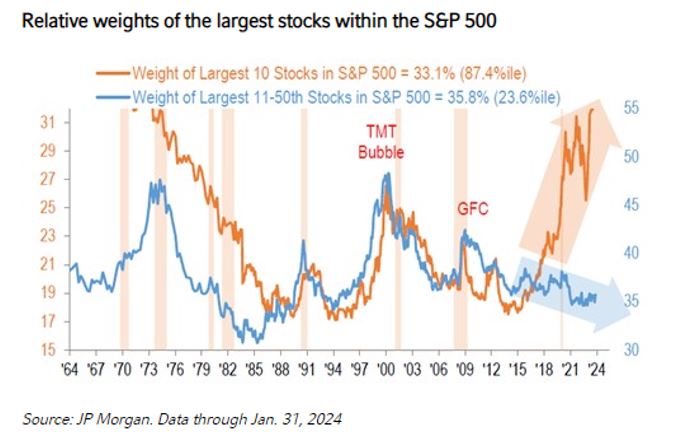
The uncertain backdrop described earlier led to stark contrasts in asset classes performance. In sterling total returns, there was a difference of more than 40% between US equities and Chinese equities for example. On the face of it, investors in the US shrugged off their macro concerns and happily invested in equities, with the US market up 25% in sterling total returns. Even more impressive, the index of technology companies rose by 35% in sterling total returns. There lies the catch though: US equities performance is increasingly concentrated in a few large technology-focused names, making headline index performance figures somewhat misleading. As an illustration, an equally-weighted version of the US equity index (a way of looking at the average company in the index) was only up ~7%. Similarly, the index of US names below the top 1000 only rose by 5%. The situation in the US is now an extremely skewed one with the so-called “Magnificent Seven” (Alphabet (Google), Amazon, Apple, Meta (Facebook), Nvidia, Tesla and Microsoft) representing close to 30% of the market (and close to 20% of the World index). Apple and Microsoft each reached the $3 trillion market capitalization mark, the first time in history. By contrast and for reference, the entire market capitalization of all the companies listed in the UK is ~ $2.5 trillion. No matter how great companies like Apple and Microsoft are, and no matter how many issues UK companies may have, it is hard to believe that each one of the former is worth more than all of the latter…As the chart below illustrates, the US market has not been as concentrated in the top 10 holdings since the mid-70s (all of the Magnificent Seven are in the top 10 companies in the index): this should be a warning sign for passive investors who are taking very a high concentration risk despite thinking they are buying the whole market.
For now though, technology and Artificial Intelligence seem to be the only game in town and UK equities, laden with “old economy” companies in resources, banking or consumer sectors, were flat for the reporting period. Europe fared better, as did Japan, matching the performance of the US and finally reaching back its all time high from 1984, as the corporate governance improvements pushed by authorities for the past few years are finally gaining traction and gathering attraction from global investors.
Global government bonds lacked direction, hurt by the volatility in interest rates expectations we mentioned earlier, but supported by their attractive coupons (the interest rate paid to investors when the bond matures). Corporate bonds fared slightly better, helped by their high coupons too, as well as strong underlying performance from the companies issuing those bonds. Finally, commodities had a mixed year with oil rebounding from low starting prices on the back of strong global demand and cuts in production from the Organisation of the Petroleum Exporting Countries (OPEC). Meanwhile, industrial metals suffered, in part, from the weakness in Chinese demand, but gold played its safety role and performed well.
Performance
After a strong last quarter in 2022 and good start of 2023, the review period saw the Fund struggle until the end of October before making most of its losses back into the end of February 2024. Its performance of -0.80% lagged its benchmarks though, the CBOE UK All Companies Index (+0.7%) and the UK Consumer Price Index (+2.8%), as well as its peer group, the IA Flexible Investment sector (+6%). Our poor performance relative to our peer group put the fund in the bottom quartile (bottom 25% of funds) for the year. Over longer periods, however, performance remains strong: top half over 3 and 5 years, and top quartile over 10 years. Unfortunately, short periods of underperformance are relatively common, a result of our focus on medium to long-term returns which implies looking through short-term volatility. As an illustration, going back to the inception of this Fund in April 2004, our Fund outperformed the UK equity market “only” 54% of months based on 6-month total returns (i.e. based on monthly 6-month rolling returns) or 1-year total returns. Our hit rate increases to 69%, however, looking at 3-year total returns (i.e. the Fund outperformed the UK market over 3 years on 69% of months) and 5-year total returns. Finally, on a 10-year returns basis, our Fund outperformed the UK market in 81% of months. The point of this analysis is to demonstrate that duration of holding periods matters and that, the longer one holds our Fund, the greater the chances of outperforming our benchmark.
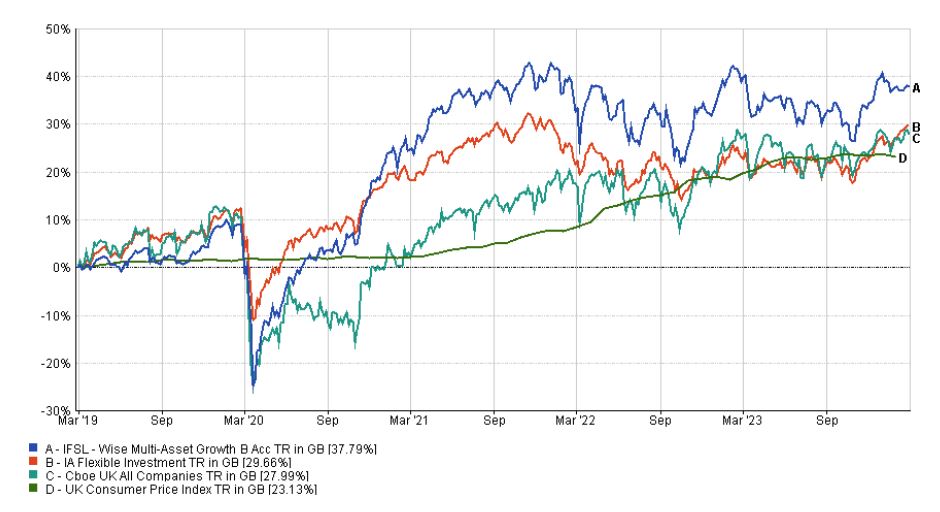
For more fund performance, please see the latest factsheet
Wise Multi-Asset Growth February 2024 factsheet
A perfect storm for investment trusts
That said, even with our objectives focused on the medium-term (which we define as 5 years), it is disappointing to report some underperformance over the period. Before discussing individual contributors and detractors, a large driver of our negative performance this period was discount widening of the investment trusts we hold in the Fund. Recent months have seen a perfect storm for the investment trusts sector, caused by continued outflows from UK equities, dislike of smaller companies, a reduction of the traditional pool of investors due to consolidation amongst wealth managers and, most frustratingly, unhelpful regulatory changes forcing long-established investors to sell. We will go in more detail about some of those headwinds below.
We talked in detail over the years about how performance in investment trusts tends to be amplified because excitement/fear about the underlying assets they invest in translates into tighter/wider discounts, thus compounding the rise/fall of those assets. While UK equities have suffered net outflows since the Brexit vote in 2016, this accelerated during the period, driven by fears of higher interest rates for longer and increased recessionary concerns. Our Fund’s direct UK exposure is only ~17%, but all of our investment trusts (68% of the portfolio at the end of the period) are listed there. Moreover, the trusts and assets we tend to favour are not in the largest companies, because we find many more pricing opportunities away from mainstream names. Over the period, the UK medium-sized companies index underperformed its large companies counterpart by 1.5%, due of its greater exposure to domestic companies. Many of our investment trusts form part of that index and, as is often the case in panic-driven weaknesses, were sold indiscriminately as part of that basket of names, thus driving discounts wider.
Regulatory changes on costs disclosure also had a widespread negative impact on all investment trusts. New rules, which are actively being challenged in Parliament as we write, force funds of investment trusts to double-count the costs of the trusts they invest in, thus artificially inflating the Ongoing Charges Figures (OCF) disclosed to clients. Unlike open-ended funds (e.g. OEICs or unit trusts) where fees are deducted annually from the investors’ value, investment trusts have their fees accounted for in the Net Asset Value (NAV) which is separate from the price investors pay (hence the discount/premium a trust can trade at). The price is thus already discounting the fees on a trust, like for an equity, meaning that disclosing that cost separately is equivalent to double-counting it. This change of rule from the regulator has forced many investors out of investment trusts because their clients risked being put off by what appear to be higher fees now being disclosed, even though the change is purely presentational and has no impact on either performance or their wallet. The most frustrating aspect of this regulation is that the British regulator blames European regulation for this change, and yet it is the only European country to have interpreted the regulation so absurdly. As such, the UK took the active decision to shoot herself in the foot, creating widespread damage to a once vibrant sector which represents roughly a fifth of all the listed companies in the UK and is perfectly positioned to provide capital to the exact areas the government is keen to promote, like infrastructure and renewables, or domestic private equity. No other fund structure can offer such an easy, liquid and affordable access to those sectors for retail investors. We can thus only hope that reason will prevail and that this double-counting of costs will come to an end soon.
While forced selling offers opportunities by widening discounts (more sellers than buyers), in the short-term, it led to increased volatility and a downward pressure on prices, and thus performance.
Looking at the entire universe of investment trusts in the UK, discounts widened by ~4.5% between the end of February and the end of October 2023 when the average discount reached the widest since the GFC. This headline figure hides some greater moves which, although of limited impact to our Fund, are still worth highlighting, such as Property investment trusts discounts widening by ~11% and Infrastructure ones widening by close to 15%.
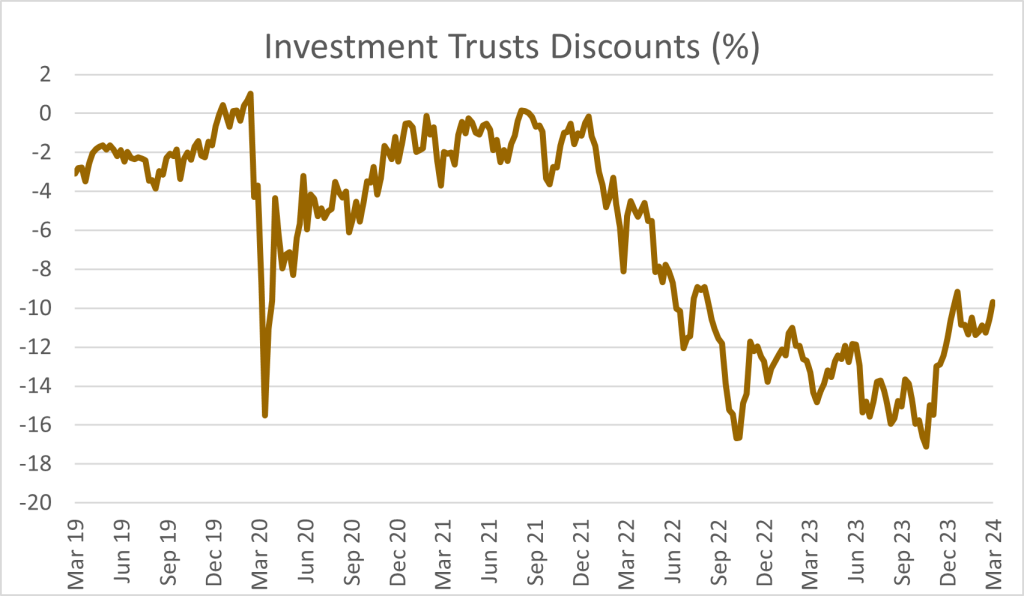
The chart shows the average of discounts/premiums for all investment trusts listed in the UK, weighted by market capitalization
The more interest rates sensitive the strategy, the more impacted they were, but the impact was widespread, creating a headwind for our approach. The average discount on the trusts we own in the Fund followed a similar pattern, starting the period at 11% and widening to 17.6% at the end of October. By the end of the reporting period, discounts had tightened again and rebounded from their extreme October levels, but still remained wide (16% average for our Fund). Our focus on investment trusts and small/medium sized companies has historically been a strong contributor to our good long-term performance but there are periods of time (usually short) when it proves detrimental. The long-term benefits of our approach traditionally outweigh the short-term volatility though, so we continue to believe our strategy will deliver on its objectives. The investment trusts sector offers tremendous value at present, across sectors, allowing us to build a diversified portfolio with strong upside potential. An encouraging glimpse of that value was the strong outperformance of the Fund by ~4% versus both the CBOE UK All Companies Index and the IA Flexible Investment Sector between the end of October and the end of December when discounts tightened. Unfortunately, that period was short but gives an indication of the embedded value in the portfolio and the upside potential once the elastic band gets released from current extreme levels once more.
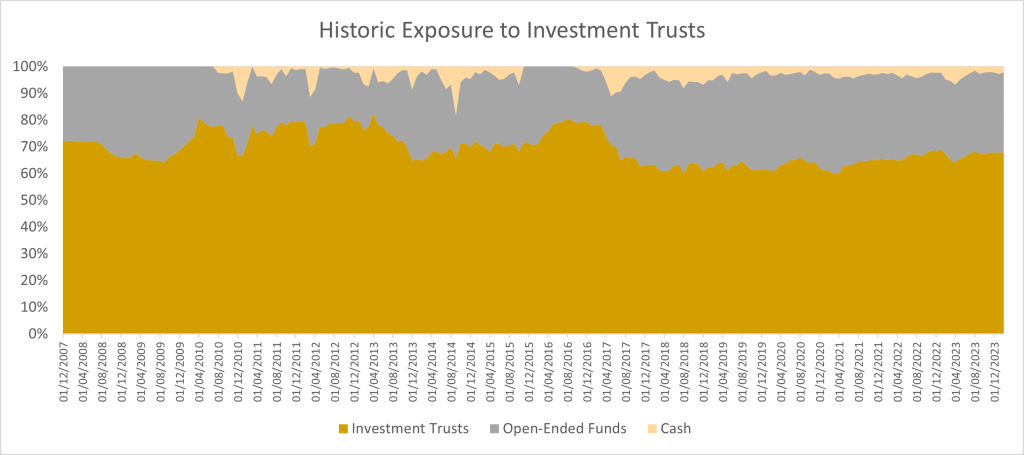
Source – Wise Funds Ltd, February 2024.
Detailed contributions to performance
On a holdings specific basis, without much surprise given the backdrop described above, our worst performers were found in China-related plays, either indirectly (BlackRock World Mining Trust) or directly (Fidelity China Special Situations). UK smaller companies (Odyssean) and interest rates sensitive infrastructure names (Ecofin Global Utilities and Infrastructure) struggled with weak NAVs and challenging discount widening. Finally, despite the good performance of precious metals, Jupiter Gold & Silver Fund hurt our performance as mining companies suffered from general investors’ apathy for the sector, despite strong fundamentals, and from a break of the traditional relationship with gold (gold miners normally deliver an amplified version of the returns of gold but this was not the case last year).
On the positive front, private equity names were our strongest contributors, particularly Pantheon International, as well as the newly added ICG Enterprise. We have talked for some time about how anomalously wide the discounts in the listed private equity sector have been, and this has been the key reason for increasing our positions. While in a “normal” environment, investors would spot those valuations anomalies, buy the shares, and help bring the discount back to at least an average level, if the anomaly persists, one would like to see support from the board of the trust. This support would typically take the form of share buybacks where the company buys its own shares back. This is not only a strong signal to the market that the people closest to the trust believe it is trading too cheaply but is also value accretive because a reduction in the number of outstanding shares increases the ownership stake for remaining shareholders. A share buyback might not always be appropriate, however, for example if a trust is small already (it further reduces the size of the trust), if it hasn’t sufficient liquidity to buy the shares, or if the managers can find better investment opportunities elsewhere. None of those was an issue for Pantheon International which had a market capitalization of ~£1.5bn, net cash available to deploy and, with a discount of 46% in the summer, offered upside potential hard to find elsewhere in the private market. As such, the board had already bought ~£20m shares back in the past year but, in its annual results at the beginning of August, its chairman made as supportive an announcement as possible by committing up to £200m to buybacks this financial year (~80% completed by the end of the review period) and, as importantly, dedicating a proportion of the Company’s net cash flow to share buybacks thereafter. This means that buybacks are now an explicit part of the investment strategy, as opposed to an after-thought, sending a strong message that, as long as the discount remains as wide as it currently is, the company will support its share price by buying and cancelling shares. This helped send the price of the trust to its highest level in a year and has turned Pantheon into an example of what strong corporate governance should look like. This was an announcement we can only hope to see replicated by other boards across the sector.
Other strong contributors included AVI Global, one of our largest holdings, which defied the poor performance of value-oriented managers and delivered strong NAV returns thanks to a number of special situations in its portfolio. It also benefitted from a narrowing of its discount. Another strong contributor was the TwentyFour Income Fund, a bond strategy investing predominantly in securities backed by mortgages which offer exposure to floating interest rates, as opposed to fixed rates. In a rising rates environment, this allows the income to rise in line with interest rates, instead of looking less and less attractive as it does for fixed rates strategies.
Allocation Changes
On the back of strong performance at the end of 2022 and beginning of 2023, we started the period on a cautious footing and a reluctance to chase valuations ever higher in the face of an uncertain macro-economic environment, with an engineered recession a possible outcome. As such, cash was our first line of defence early in the period, preferring to keep our powder dry for future opportunities as they arose. Extreme gyrations in the market’s assessment of future interest rates and increasing divergence between equity and bond markets, led us to gradually increase cash to reach a high close to 7% in April. The mini-banking crisis of March illustrated the benefits of an approach we have favoured for years: when something does not seem right, it is always best to err on the side of caution and one should not be afraid of managing cash actively. This does not mean that we predicted the crisis itself but, like in the summer 2022 ahead of the UK “mini-budget” chaos, when strong dispersion and a degree of complacency appear in financial markets, little protection is provided against the unexpected and stretched valuations correct much quicker than average or cheap ones. Raising cash is also a means to take a step back for a short period of time, to reassess conditions and stay on the front foot with funds ready to be deployed when opportunities inevitably present themselves. As it became apparent that the banking crisis was not going to be systemic, we gradually deployed some of our cash into our Defensive assets (Pacific G10 Macro Rates, Fulcrum Diversified Core Absolute Return), maintaining our wariness about investors’ future interest rates expectations, but giving ourselves the ability to generate performance in both up and down markets thanks to those very targeted and risk-controlled trading strategies.
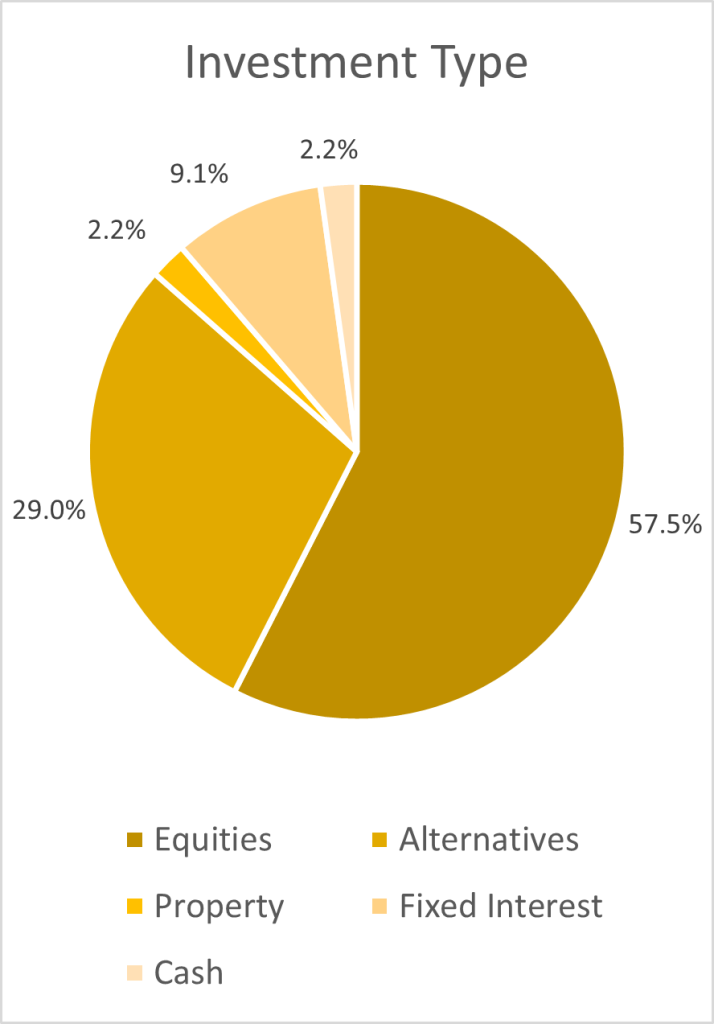
We also increased our exposure to gold (Jupiter Gold & Silver) as a hedge against a stickier inflation scenario and/or a recession. In addition, we added to two sectors which present attractive characteristics through their underlying assets and defensiveness thanks to their cheap valuations: listed private equity and healthcare. The former, which we mentioned in the previous section, is an area that has suffered from sharp discounts widening since the post-Covid recovery in 2021. The sector moved from trading at par (i.e. price the same as the NAV) in Q3 2021 to an average 40% discount by March 2023. Many investors felt concerned about how valuations in the private equity sector were produced and were waiting for private valuations to catch up public ones, given public markets had repriced lower. While we were sympathetic to the argument there was a lag in valuations that needed to be reflected in investment trust discounts, there was a disconnect between the extremely negative sentiment inherent in private equity investment trust share prices and the positive commentary we received from portfolio managers about the growth in their underlying holdings, which remained generally robust and thatCovid was a blip they had more than fully recovered from. Following our names closely, these comments applied to all of them, so we were thus keen to take advantage of stretched under-valuations in the sector. Being heavily weighted towards Pantheon International, Oakley Capital and Caledonia Investments (2/3 in private equity) already, we added a new position in the ICG Enterprise Trust, a manager focusing on resilient growth stories in private markets which we already owned in the past, at ~45% discount.
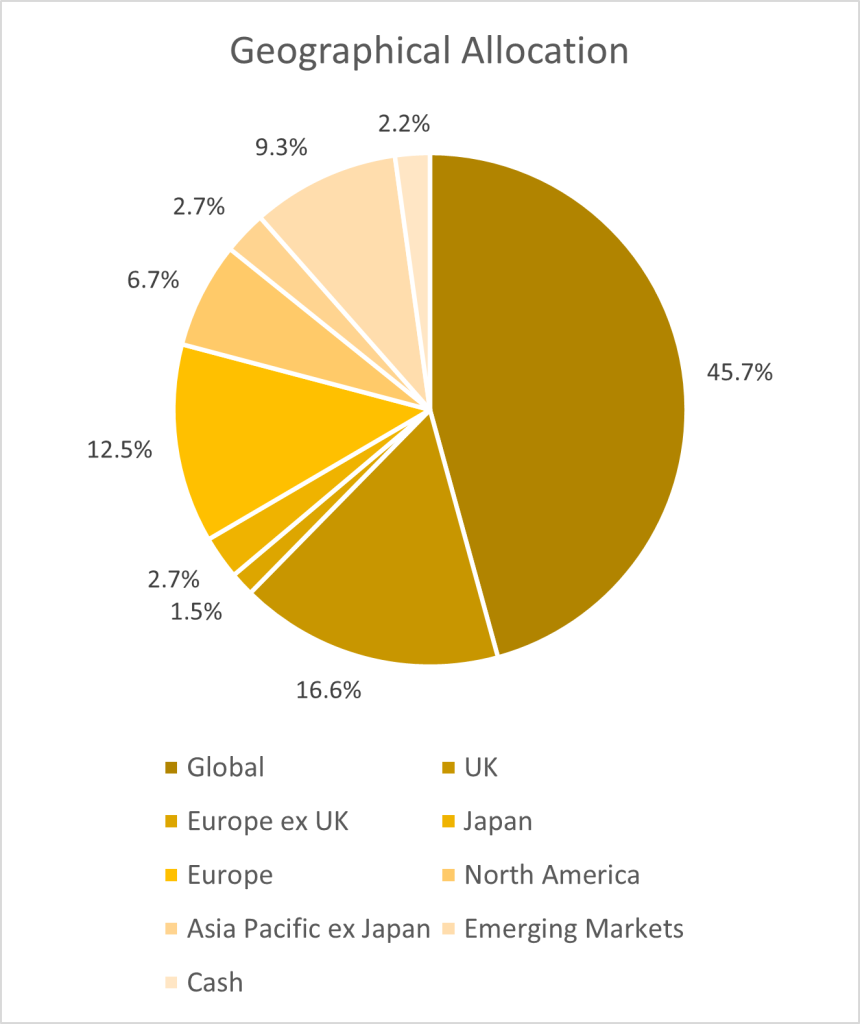
Healthcare and biotechnology is an area we have added to since the start of 2022, attracted by the structural tailwinds of supportive demographics (ageing population in increasing need for care) and a boom in innovation leading to a plethora of new drugs coming to the market (illustrated beautifully by the speed at which Covid vaccines were developed in 2020). The sector suffered a hangover after strong performance in Covid times, to a point where valuations are now as attractive as they have ever been. Moreover, a spate of older drugs reaching the end of their patent protection at large pharmaceutical companies should lead to an explosion in acquisitions of smaller biotechnology companies as the only way for larger players to inject growth in their businesses. All those characteristics make the sector very appealing at present. As such, we increased our allocation to Worldwide Healthcare, as well as adding a new position in RTW Biotech Opportunities. This trust is unique in the space by bridging the gap between private and public markets, investing in companies from their earliest private stages (even founding some of them) and nurturing them all the way to fully fledged listed companies. This full lifecycle approach is extremely compelling and brings a complementary angle to our other biotechnology holdings. After having built an initial position in the spring, we added to the position at the end of the period following the completion by RTW of the acquisition of one of its rivals’ portfolio (Arix Bioscience).
The Arix’s portfolio comprised of 45% in cash with the rest invested in biotechnology companies complementary to the RTW portfolio. It suffered from idiosyncratic issues leading its shares to trade at a wide discount and its shareholders to look for a way to realise some of the embedded value in the trust. The acquisition by RTW, approved by shareholders in February 2024, allows RTW to access quality assets as well as cash it can readily deploy into a very attractively valued sector. It also gave the trust immediate scale (from ~£280m market capitalisation on the announcement of the deal to £412m at the end of February) which is critical in order to attract new investors and help reduce the discount of ~30%. Given some complexities in the proposed deal, we had waited for completion before adding to our position but did so on a dip mid-month after confirmation of the vote. This deal is a good illustration of the opportunities thrown up by the current difficult market conditions within the investment trust sector. We are confident that these sorts of opportunities will reward patient investors.
Other than those large changes, as always, we were active in rotating the portfolio between winners and losers, this strategy being an integral part of our value discipline. As such, we took some profits in some of our more successful equity strategies principally in Asia (Fidelity Asian Values), Japan (AVI Japan Opportunities) and Europe (European Smaller Companies, Henderson EuroTrust which was exited fully). We also trimmed our position in BlackRock Frontiers, an emerging markets strategy focussed on smaller countries in the space. Finally, we exited our positions in Herald and Baker Steel Resources, both being too small. In addition to the new positions in ICG Enterprise and RTW Biotech Opportunities mentioned earlier, those profits were recycled into underperforming areas such as Infrastructure (Ecofin Global Utilities & Infrastructure, Premier Miton Global Infrastructure Income), UK equities (Odyssean), private equity (Caledonia Investments) and Emerging Markets (KLS Corinium EM). Uncertain environments like the one we are currently in necessitate nimbleness. Active management allows to lock profits in as and when they occur and constantly recycle those into better valued opportunities.
Outlook
As inflation remains sticky, we are preparing ourselves for financial markets movements to continue evolving at the whim of monthly data releases. With an increasing number of investors once again crowding back into assets like large technology companies which, while undoubtedly great businesses, offer investors very little room for error given their stretched valuations. We are keen to maintain a degree of cautiousness and focus instead on opportunities that we believe provide greater upside potential per unit of risk. Hopefully we have made clear in this report that such opportunities abound in the investment trust sector, across various asset classes and without the need to take undue risk. They also can offer a way to gain exposure to those popular themes, such as technology, but at much cheaper valuations and without having to compromise on quality. Our private equity managers, for example, all have significant exposure to technology names, but these companies are much smaller (and thus offer greater scope for growth), are directly controlled by the managers of the trusts we buy (rather than being a passive investor in a listed company), and we access them via trusts trading at more than 30% discounts. We think this is a highly compelling proposition, allowing us to get exposure to growth themes without compromising on our value discipline. A similar argument can be made about our exposure to healthcare and biotechnology, or renewable energy.
Despite short-term disappointments, we remain confident in our strategy that has remained consistent for the past nearly 20 years and has produced strong results. As difficult as the current environment is, we believe in the quality of our managers and know that the current valuations on offer within investment trusts will reward our patience. The past year presented a number of challenges, but we truly believe our Fund is correctly positioned to reward our investors (of which we are significant ones too, both directly in our Funds and as employee-owners of the company). We are thus excited by the opportunities that lie ahead.
As a silver lining in what was, otherwise, a challenging period, we are pleased to announce that the WS Wise Multi-Asset Growth Fund was named Fund Manager of the Year 2023 by Investment Week in the Flexible Investment category. This award honours fund managers who have demonstrated consistently strong performance for the previous 3 years, using a combination of quantitative and qualitative metrics. It is a proud achievement for our team to have won this coveted award, particularly given the 3 years considered covered some of the most challenging and rapidly shifting market conditions since the Great Financial Crisis. The WS Wise Multi-Asset Growth Fund was the only fund in the IA Flexible Investment sector to deliver top quartile performance in each of 2020, 2021 and 2022 demonstrating our genuine multi-asset and flexible strategy. We will continue to use the same investment approach as we have since we launched the Fund in 2004, and will strive to live up to this award for the many years to come.
Finally, on a technical note, you will have noticed that the name of our Fund changed throughout the year. UK funds need to have the designation of their Authorised Corporate Director (ACD) in their name. The ACD is ultimately responsible for a fund’s compliance, as well as ensuring the fund is managed in the best interests of their investors. The ACD is also in charge of appointing the fund manager (in this case, us at Wise Funds). We started the year with T.Bailey as our ACD (the “TB” at the start of our Fund’s name). During the period, T.Bailey were acquired by Waystone, hence the change of prefix from “TB” to “WS”. Meanwhile, since the end of the reporting period, after a peers review, we have concluded that our and our clients’ needs would be better served by switching to another ACD, called Investment Fund Services Limited (IFSL). This means that our Fund’s name will, once again, change to IFSL Wise Multi-Asset Growth from the period starting 1st March 2024. While the acquisition of T.Bailey by Waystone was out of our control, the move to IFSL is not a decision we took lightly because we know how disruptive and confusing those changes can be for our clients. As the fund managers of your Fund, we can reassure you that nothing has changed at Wise Funds Ltd, from a personnel or management perspective. We thus apologise if these changes raised any concerns.
I would like to thank, personally and on behalf of the Wise Funds team, all our investors for their ongoing support, particularly in the current challenging times for financial markets. The Fund started the interim period with £89m under management and finished with £80m, mostly due to poor performance and some outflows.
Please feel free to contact us if you would like a meeting or have any questions.
Vincent Ropers
Fund Manager
Wise Funds Limited
March 2024
TO LEARN MORE ABOUT THIS FUND , PLEASE CONTACT
01608 695 180 OR EMAIL JOHN.NEWTON@WISE-FUNDS.CO.UK
WWW.WISE-FUNDS.CO.UK
Full details of the IFSL Wise Funds, including risk warnings, are published in the IFSL Wise Funds Prospectus, the IFSL Wise Supplementary Information Document (SID) and the IFSL Wise Key Investor Information Documents (KIIDs) which are available on request and at wise-funds.co.uk/our funds The IFSL Wise Funds are subject to normal stock market fluctuations and other risks inherent in such investments. The value of your investment and the income derived from it can go down as well as up, and you may not get back the money you invested. Capital appreciation in the early years will be adversely affected by the impact of initial charges and you should therefore regard y our investment as medium to long term. Every effort is taken to ensure the accuracy of the data used in this document but no warranties are given. Wise Funds Limited is authorised and regulated by the Financial Conduct Authority, No768269. Investment Fund Services Limited is authorised and regulated by the Financial Conduct Authority, No. 464193.
This presentation is for Professional Clients only and not for re-distribution.
All data is sourced by Wise Funds and any third party data is detailed on the specific page.


